


Since last year’s passing of the OBBBA, many investors and households have been eagerly anticipating tax season, expecting refunds to be a meaningful tailwind to consumer spending this year. But with oil prices spiking since the start of the Iran conflict, there’s fear that consumers will be putting that extra cash straight into their gas tanks.
So, where does this net out for the consumer?
We dug into the IRS data, oil prices at the pump, and broader economic metrics to see exactly how this cash injection is playing out.
Are Tax Refunds Trending Higher?
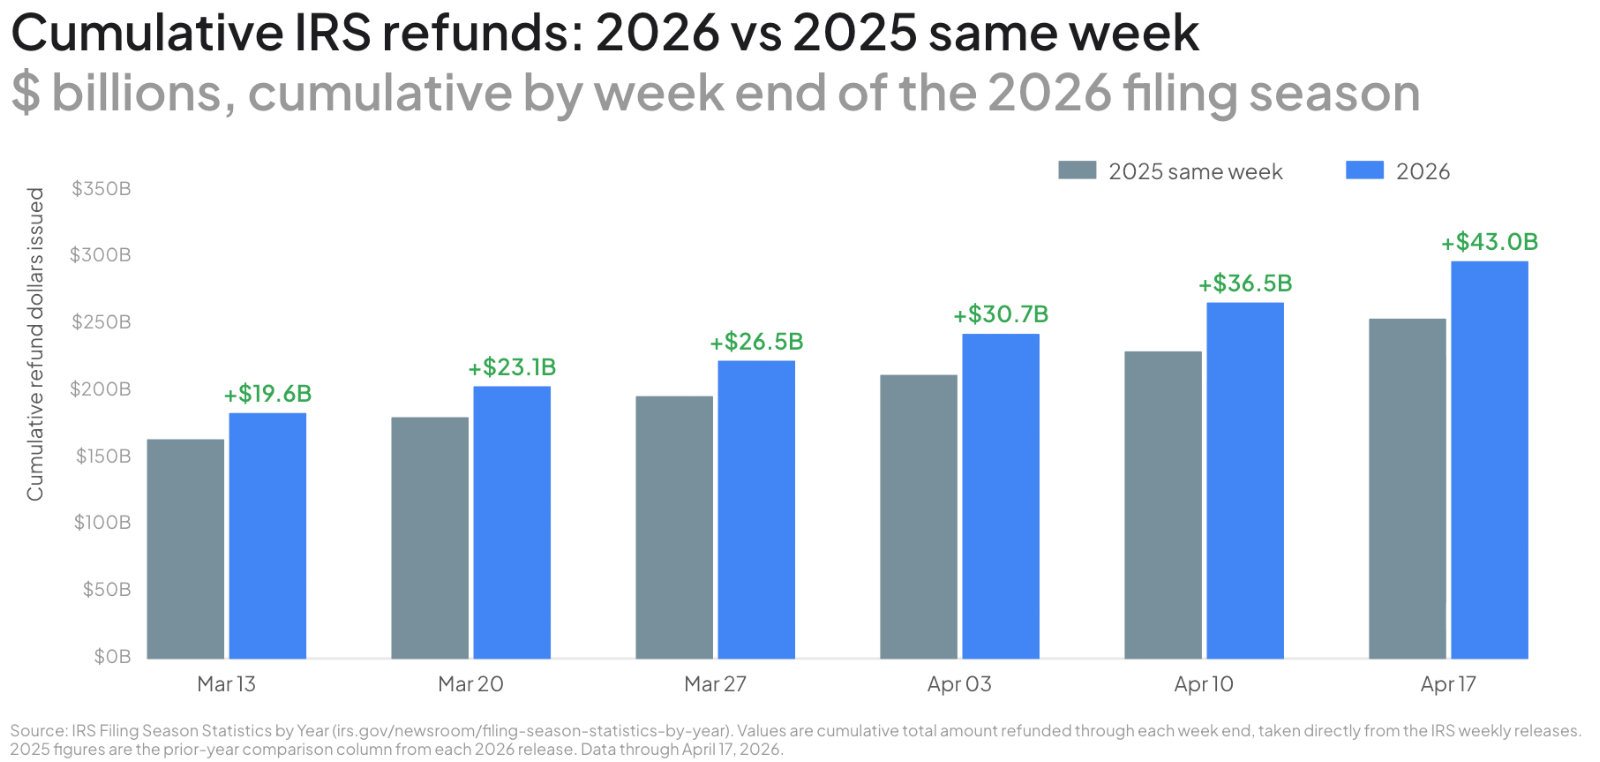
The short answer is yes. Across almost every metric, tax refunds are injecting more capital into households this year. Through the week ending April 17, cumulative IRS refunds issued stand at $296B. That’s an extra $43B compared to the same week in 2025, a 17% increase.
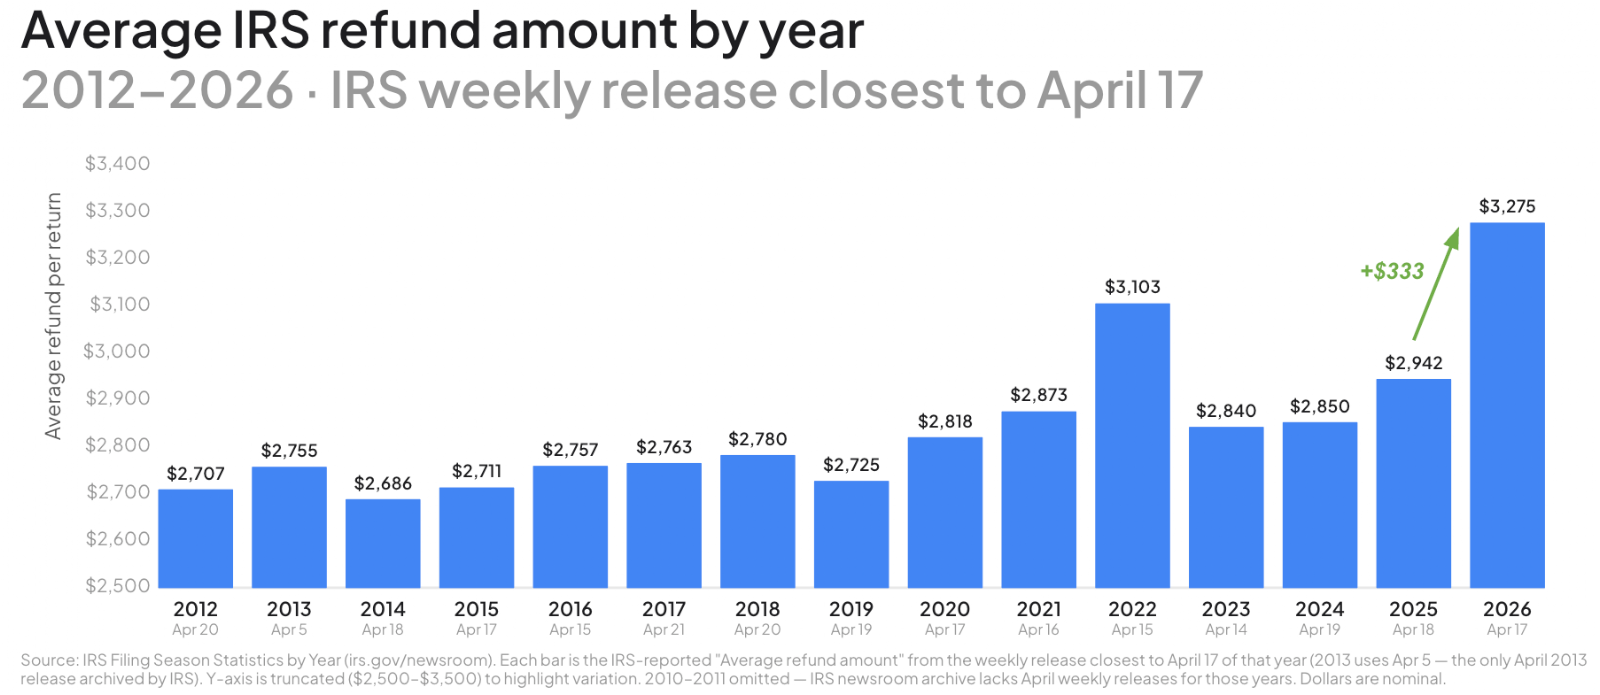
On a per-household basis, the average refund is also up meaningfully. With the exception of 2022, when COVID-era stimulus programs and post-pandemic wage recovery triggered a spike in refunds, the average tax refund has stayed around $2,700 - $3,000 since 2012.
Refunds in 2026 have broken out of that range and are currently averaging $3,275; up 11% from $2,942 in 2025.
The percentage of households getting refunds is also trending higher in 2026, but with a caveat. The refund rate has jumped to 65%, compared to 62% at the same time last year. However, this is largely mean reversion towards historical averages; the pre-OBBBA baseline rate was 72%

Who is Getting These Refunds?
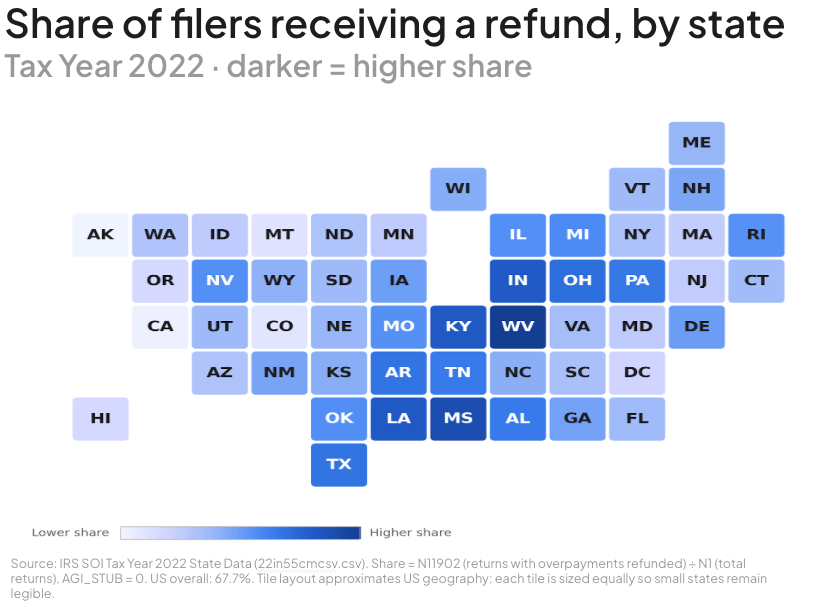
Refunds are not distributed evenly across the country, nor across tax brackets. The odds of getting a check from the Treasury depends heavily on geography and income.
State-by-state variations: Top-ranking states for average refunds include Florida, Texas, and Wyoming. These states do not have a state income tax, which often leads to higher federal withholding and conservative W-4 behavior. Conversely, states like Maine, Wisconsin, and Oregon sit at the bottom. In high-tax states, higher earners are often negatively affected by the SALT cap, leading many to owe money or make estimated tax payments rather than receive a refund.
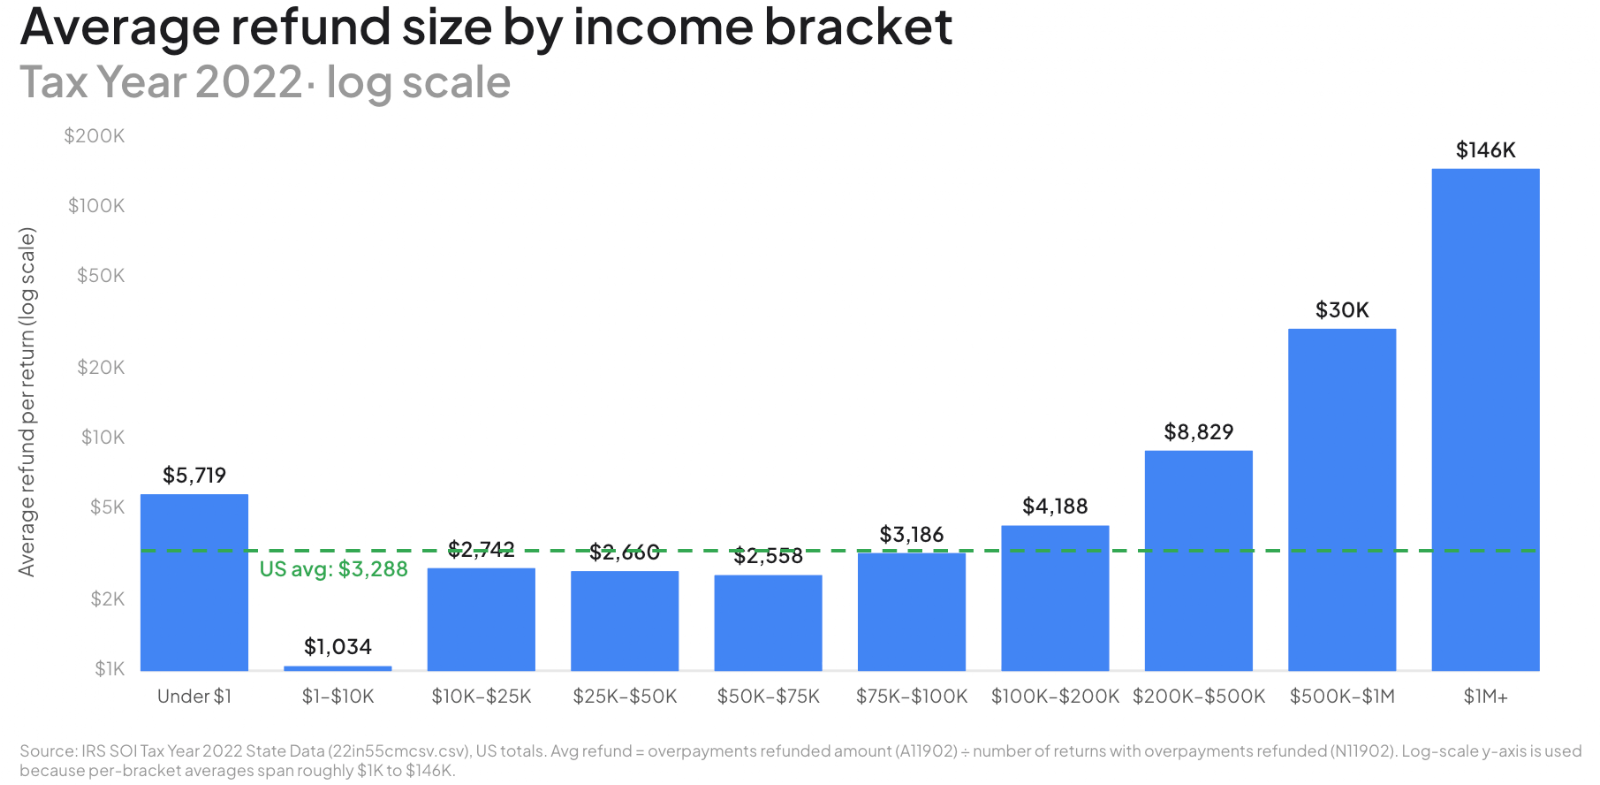
Income level variations: Lower-income households are significantly more likely to get a tax refund than their high-income counterparts. The median refund recipient falls in the $25k-$50k income bracket. While refunds are more plentiful on the lower end of the income spectrum, they are also much smaller than those seen by higher earners. Per the latest data, for filers earning $500K-$1M who received refunds, the average was $30k. For those making over $1M, the average was nearly $150,000. This isn’t surprising: small mistakes in withholding throughout the year can lead to big dollars coming back for high earners.

What About Tax Savings Overall?
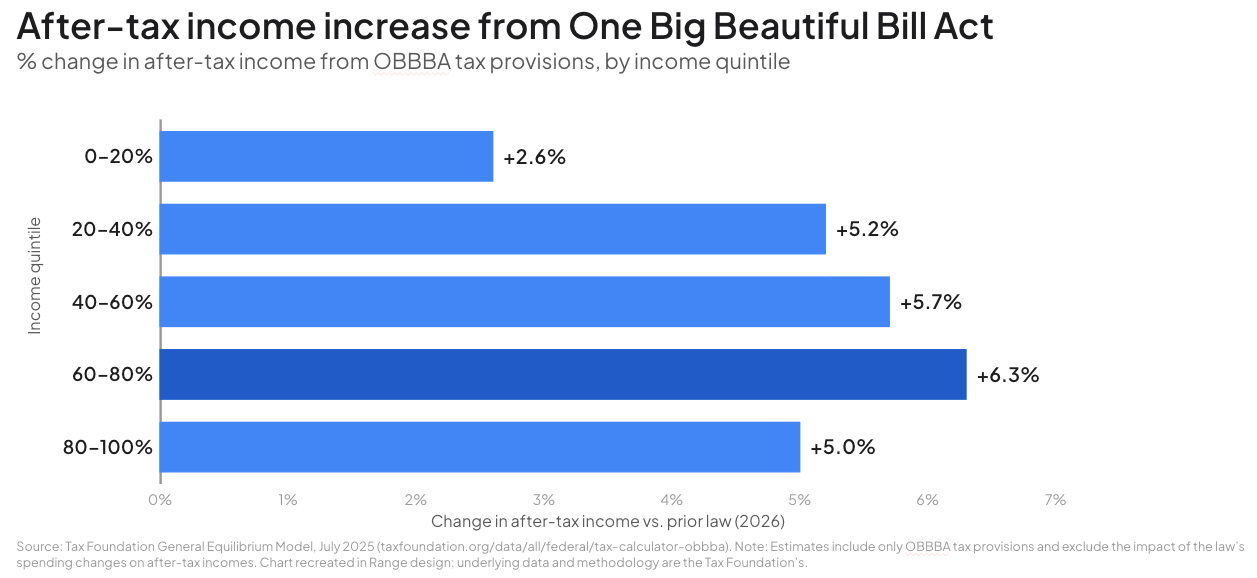
Refunds ultimately are a function of withholding accuracy. They can act as a seasonal tailwind for households that over-withheld the year before, but what really matters is how much of your gross income you keep in your pocket throughout the year. Because of the OBBBA, the answer for most households is: more.
Assuming the exact same income profile, household characteristics, and deductions in 2025 vs. 2024, many households should be seeing a 5-6% increase in after-tax income. That should provide a boost to consumer spending for years to come relative to the prior tax regime.
Factoring in the Headwind from Gas Prices
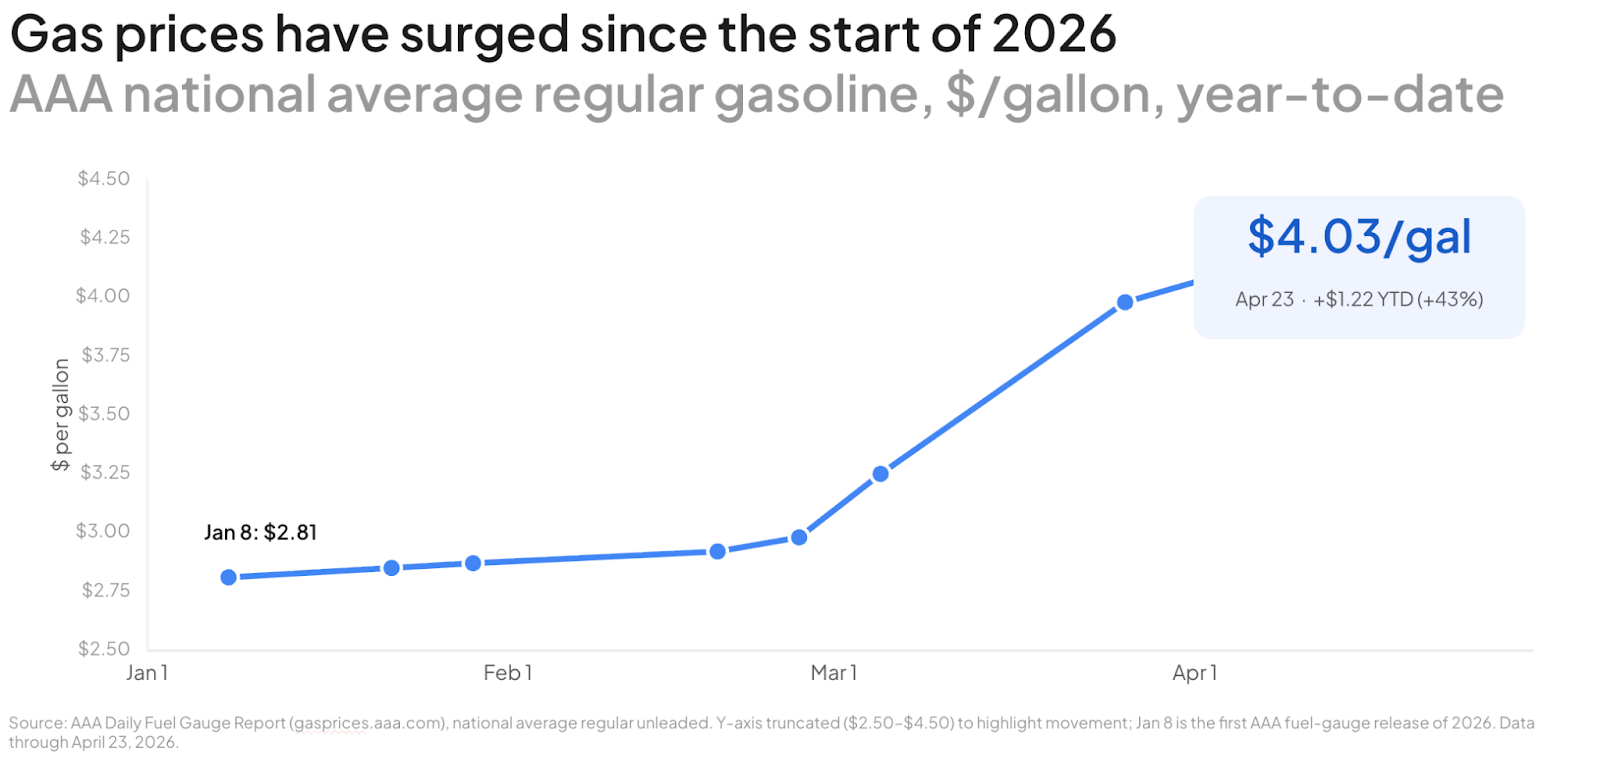
At the same time that record refunds are filling Americans’ pockets, $4 gas is filling their tanks. The Iran conflict and its disruptions to the global oil market have caused a direct, daily hit to consumer transit budgets. Our analysis indicates Americans have spent $13.5 billion more at the pump since the start of the Iran conflict than they would have if gas prices remained at pre-conflict levels.
Oil touches everything, and it is the most visible inflation barometer for everyday Americans. Few other goods are so frequently purchased, and none have their prices posted on nearly every street corner.
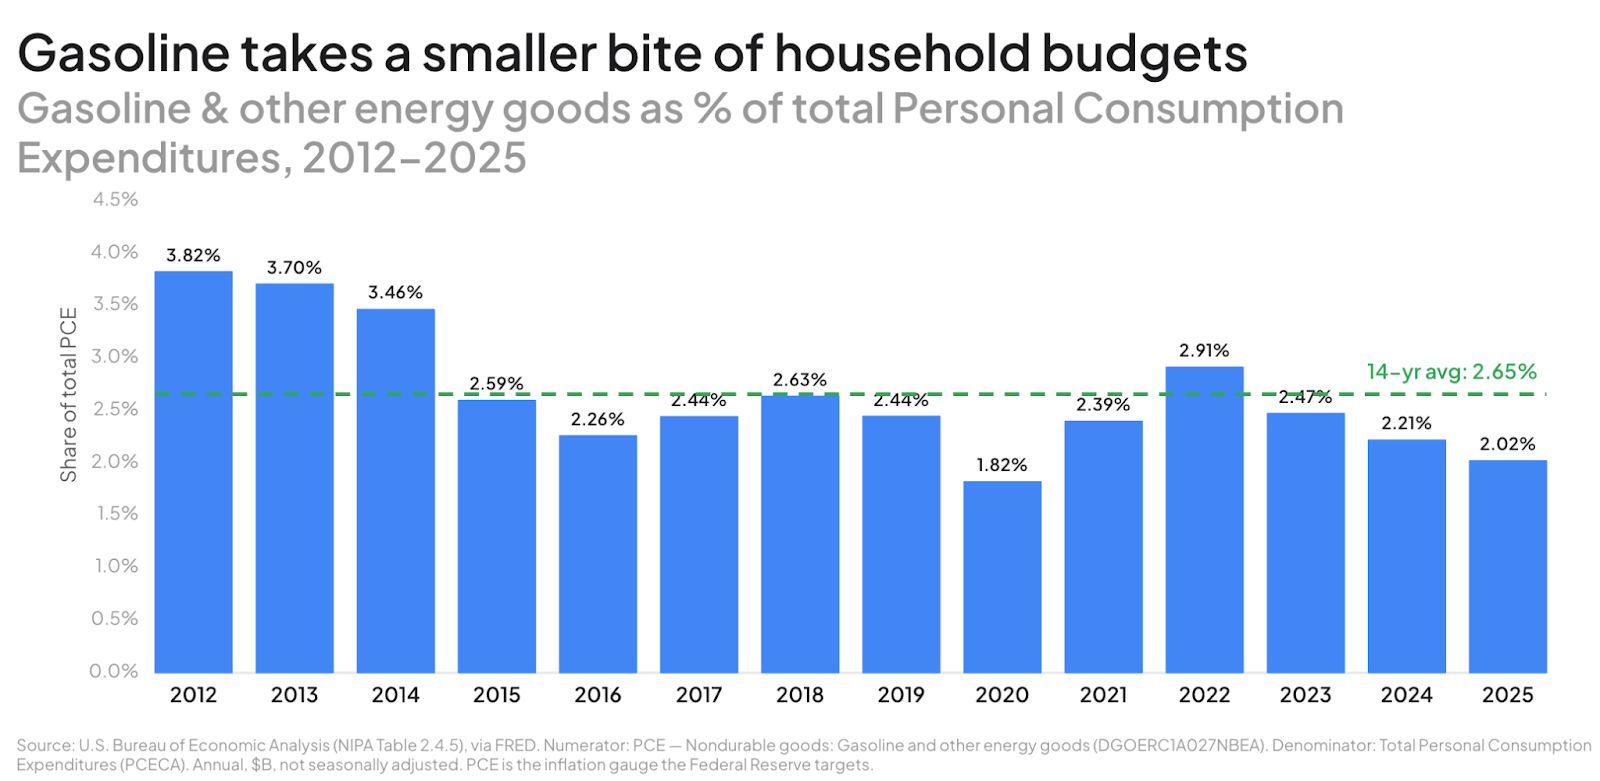
The good news is that the economic footprint is smaller than the psychological one. The Fed’s preferred inflation gauge, Personal Consumption Expenditures (PCE), estimates spending on gasoline is only 2% of the average American’s budget — the lowest share since the pandemic.
What Does This Mean for the Economy?
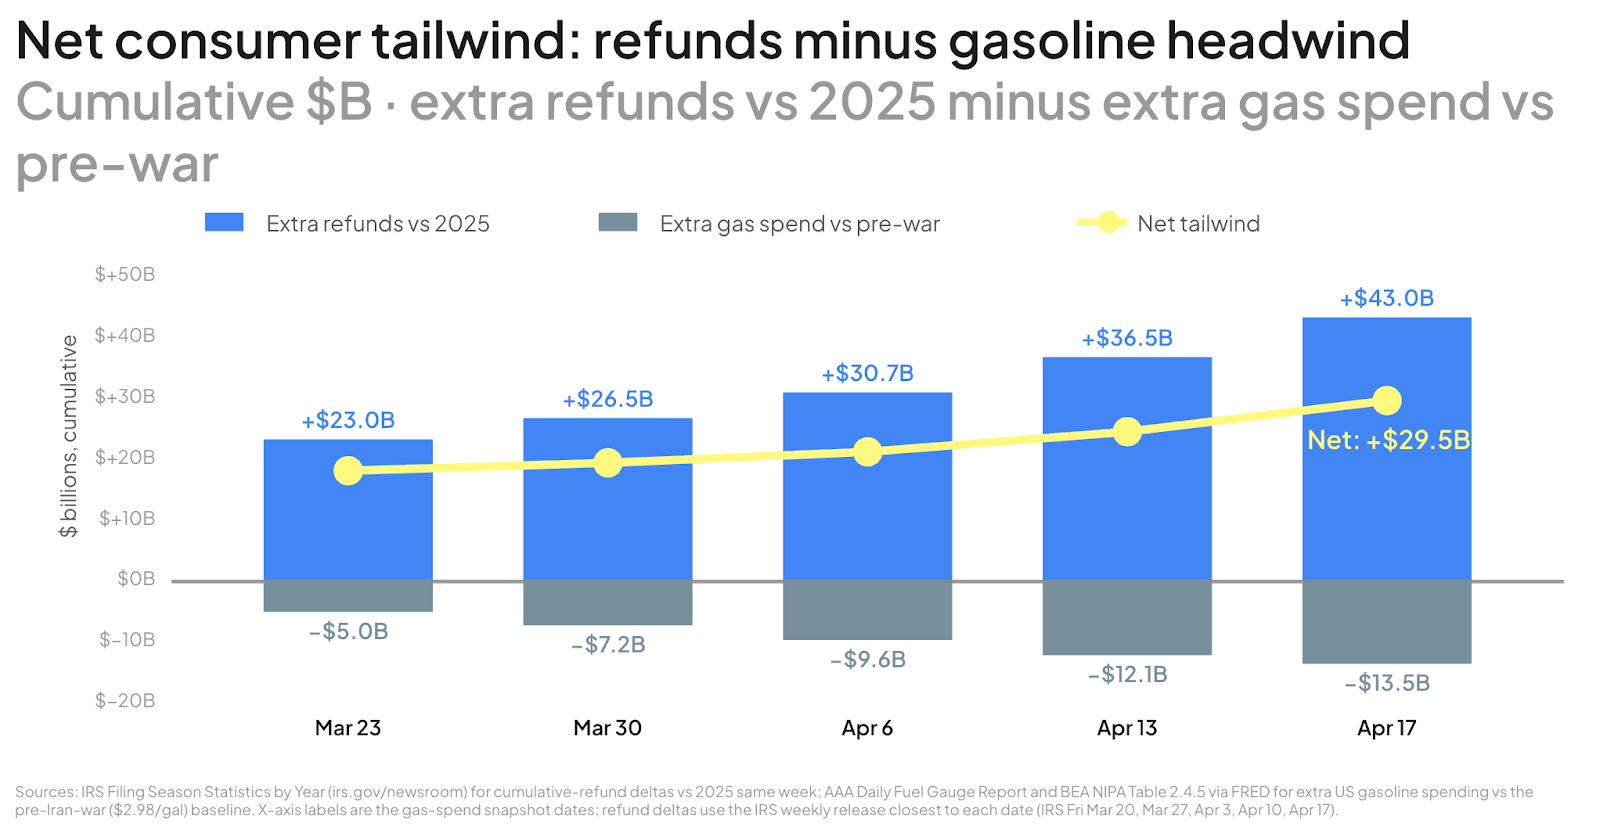
Putting the two forces side by side, the economic narrative right now is a tug-of-war between the refund tailwind and the gas-price headwind.
- The Refund Tailwind: The cash injection is large and sent in real time, delivering $43B in cumulative additional tax refunds compared to the same week in 2025.
- The Gasoline Headwind: Consumers are feeling the pinch at the pump, with higher gasoline spending creating a $13.5B drag relative to the pre-war baseline.
- The Net Effect (so far): Right now, the tailwind is comfortably winning. Through mid-April, the influx of tax refunds is outpacing the drag of higher gas prices by a roughly 3-to-1 margin. This means that even after absorbing the extra cost at the pump, consumers are still walking away with a massive $29.5B net surplus. Adding to that cushion, the broader economy is much less vulnerable to fuel prices today than in recent years, with gasoline commanding its lowest share of everyday spending since the pandemic.
How Long Can We Keep The Lead?
Assuming refunds continue their +17% pace over last year, total excess reimbursements should settle around $56 billion this year. Gas prices would need to stay above $4 until August to fully deplete the extra dollars Americans received this tax season. With the Iran conflict unresolved heading into summer driving season, this is still a live scenario. The tailwind is winning today and will help near-term spending data. Whether that cash cushion lasts all the way to Labor Day remains to be seen.
The Bottom Line
For You: Whether you are getting a refund depends heavily on your state, income level, and withholding elections. If you are a high earner receiving a massive refund, that could simply mean you have been over-withholding throughout the year—effectively giving an interest-free loan to the IRS. Paying a tax liability in April may seem painful, but the silver lining is that you kept those funds and hopefully had that capital working for you in the market instead.
For the Market: Refunds were supposed to benefit consumer spending this year, and the data prove they are. While part of that cash injection is being eaten up by gas prices, the net effect remains decisively positive. The final economic benefit for this year will depend on how quickly oil supply can normalize. But OBBBA's structural tax relief operates over multiple years and compounds. The refund tailwind isn't a one-summer story.
Disclosure:
This communication is for informational purposes only and does not constitute investment advice or a recommendation to buy, hold, or sell any security. Forward-looking statements involve risks and uncertainties. Past performance is not indicative of future results.


.svg)
.svg)
.svg)

