


One of the biggest investor concerns entering 2026 is that markets seem “too expensive” to keep climbing. It’s true that the S&P 500’s valuation is high relative to history—not far from levels that preceded the dot-com bubble.
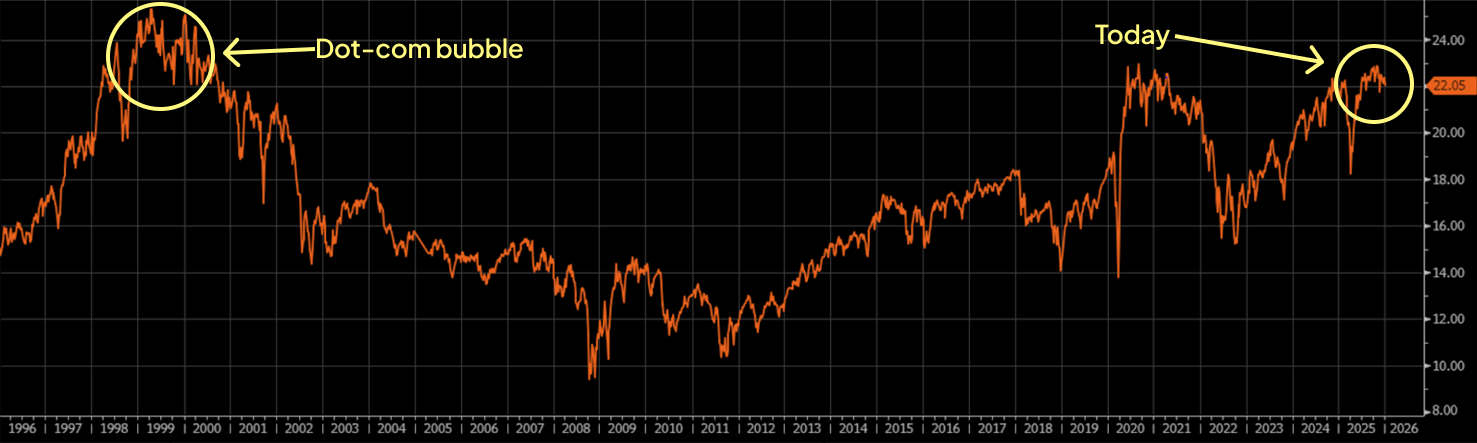
But comparing today’s Price-to-Earnings ratio to historical averages is too simplistic. When we add context, we see a market that’s elevated but not nearly as extended as the late 1990s. Here’s why the comparison falls apart when you look closer.
Three Reasons Today Is Different from 1999
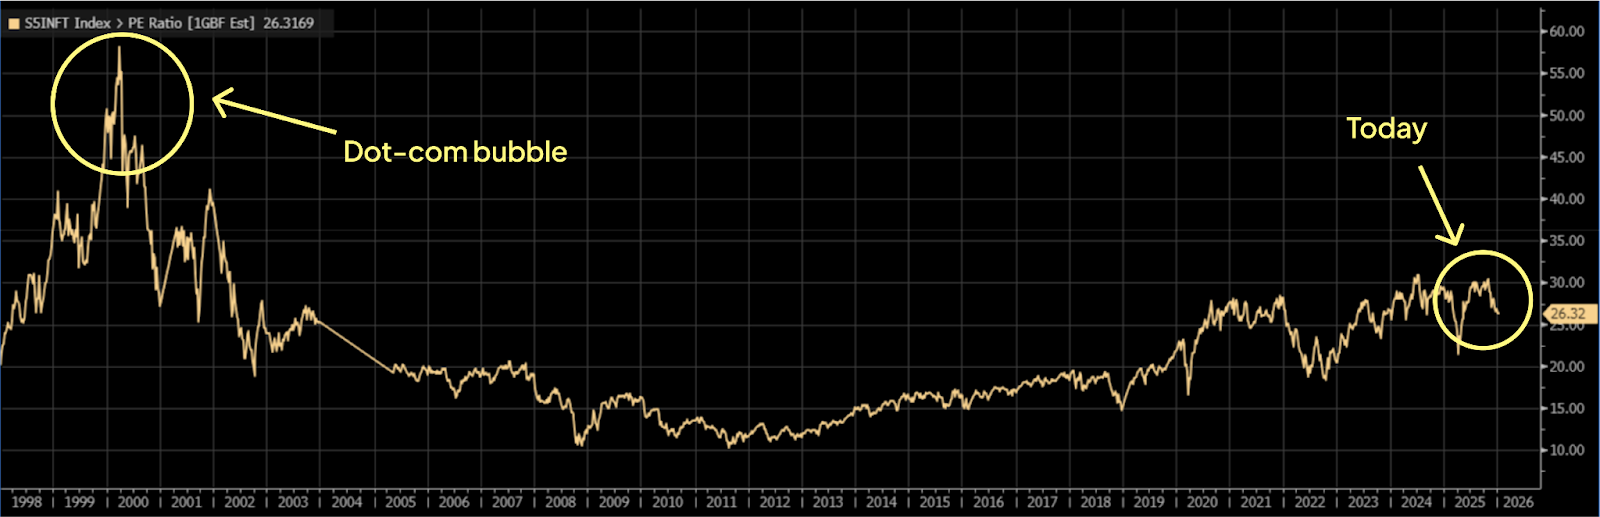
1. Tech is Trading At Significant Discount vs. 1999
There has been significant attention on tech valuations in particular. This isn’t a surprise as the tech heavy “Mag-7” has dominated market performance for the last three years. However, the reality is that the largest tech companies are not trading anywhere near the nosebleed valuations reached during the dot-com mania. In 2000, the S&P 500 Technology Index was trading at nearly 60x P/E. Today, this index is trading at a much more reasonable ~26x, or nearly 60% cheaper than the prior peak.
2. The Overall Index is Significantly Higher Quality
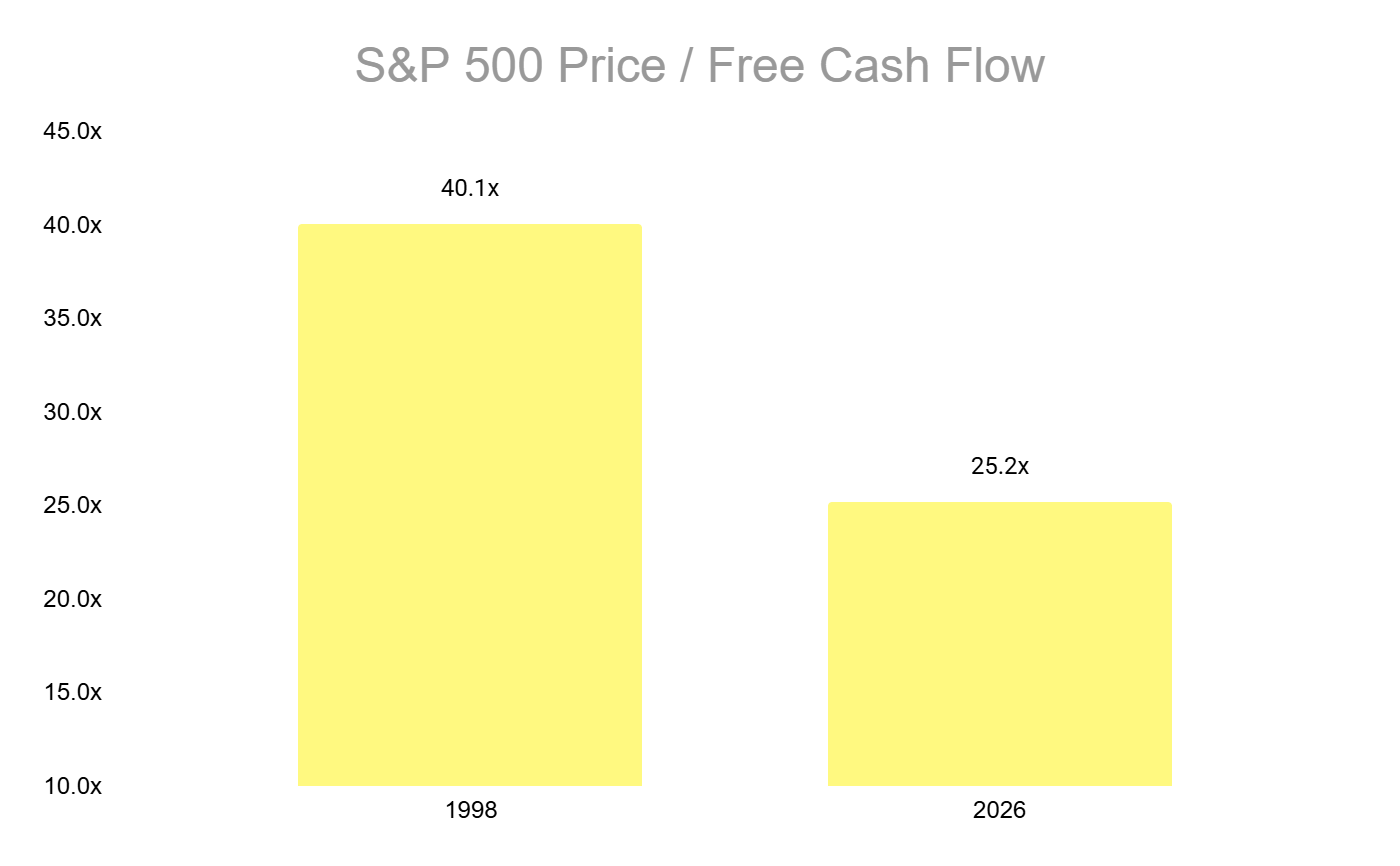
The composition of the S&P 500 has also fundamentally changed over the past 25+ years. In the late 1990s, many of the most “exciting” companies were early-stage, cash-burning businesses with unproven models—particularly across the internet/telecom complex. Today’s index is far more heavily weighted toward high-margin, asset-light platform businesses with fortress balance sheets and durable free-cash-flow generation.
This matters because cash flow is what ultimately pays investors. When you look at valuation on a cash flow basis, using a Price-to-Free-Cash-Flow multiple instead of P/E, the valuation story of the S&P 500 looks dramatically different. Today’s index is of much higher quality, and trading at a wide discount to levels reached preceding the dot-com crisis.
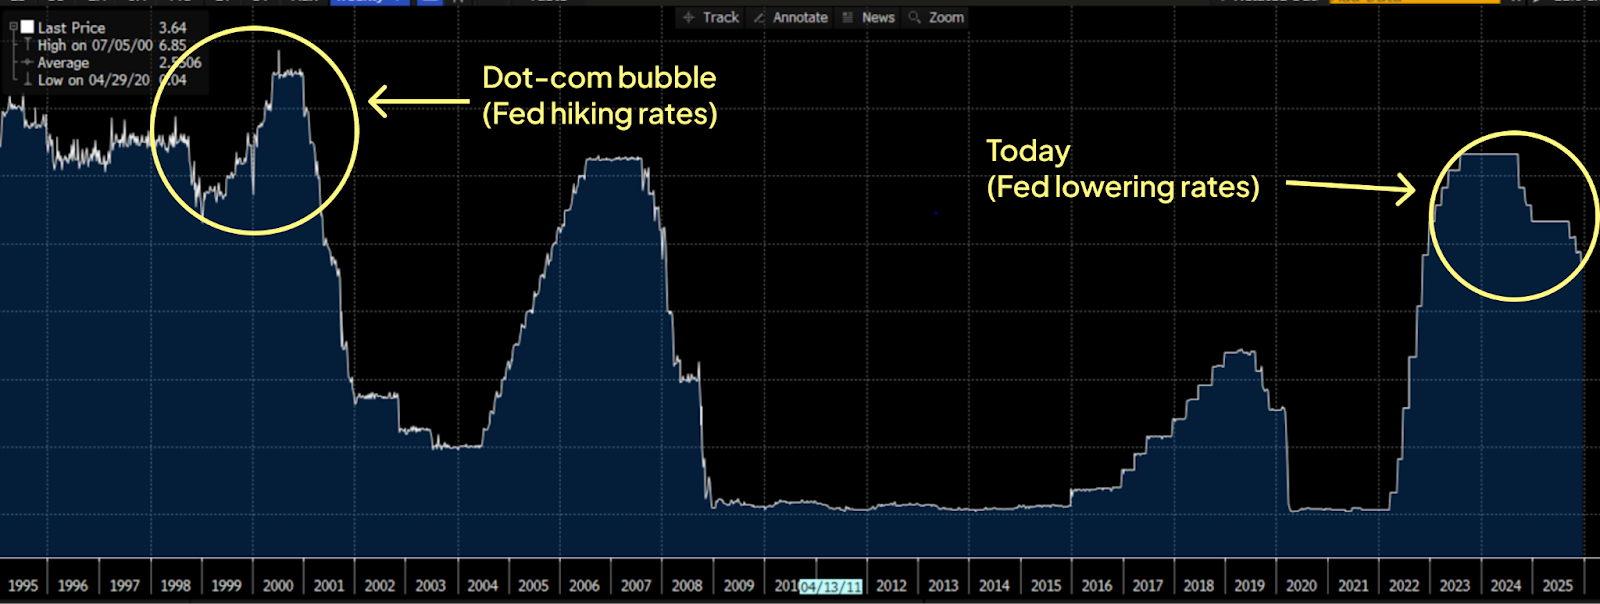
3. Different Fed Policy Dynamics
As we discussed in our Macro Reset outlook, we believe the Fed is the variable that matters more than valuation. A key distinction between today and the dot-com era is that in the late 1990s, the Fed was hiking interest rates and attempting to slow down the economy and compress valuation multiples. Today, the Fed is doing the opposite. They are actively cutting rates and easing liquidity.
The Outlook For 2026 – The Risk is to The Upside
The market enters 2026 with an uncomfortable headline: the S&P 500 screens “expensive” on traditional P/E metrics. But the dot-com comparison is the wrong mental model. Today’s index is higher quality, mega-cap tech is not priced like 1999, and—most importantly—the Fed is easing rather than tightening. Taken together, that’s a setup where valuation can hold stable or even expand.
For the second straight year, we expect valuation multiples to generally hold steady and market performance to be earnings led. That said, we think there’s upside risk to valuations as the “other 493” S&P 500 companies—trading at average valuations—have significant room to re-rate higher. Of course if we do start entering bubble-like territory, history shows that even megacap tech valuations can jump meaningfully from here.
But are we entering an AI bubble? We adapted Ray Dalio’s classic six-part 'Bubble Indicator' to diagnose the current landscape. Continue reading our 2026 Market Outlook.
Disclosures:
This communication contains forward-looking statements that reflect Range Advisory, LLC’s (“Range”) current views, expectations, beliefs and/or projections about future events or results. Forward-looking statements involve risks and uncertainties — including, without limitation, market conditions, regulatory changes, economic conditions — any of which could cause actual results to differ materially from those expressed or implied by such statements. Range undertakes no obligation to update or revise any forward-looking statements to reflect new information, future events or otherwise, except as required by law. Recipients should not place undue reliance on forward-looking statements, which are presented for informational purposes only and do not constitute investment advice or a recommendation to buy, hold, or sell any security. Past performance is not indicative of future results. The views, opinions and analyses expressed by Range in this material are those of Range as of the date shown, and are provided for informational purposes only.


.svg)
.svg)
.svg)

